Menu


Tracing heat and flood risk in Boston
June 1, 2023
As climate change exposes cities to more frequent extreme heat and flooding events, city planners and local leaders are looking for more detailed information on neighborhood-level risks to help prepare for disaster. In ESI director John Fernández’s Urban Metabolism Group, recent MIT graduates Katherine Xu and Anushka Ray have developed a new tool to perform these analyses swiftly and using publicly available data.
The project was organized by ESI Postdoctoral Associate Norhan Bayomi, who wanted to explore using computer vision to create city-wide maps of heat and flood risk. Bayomi had pursued this kind of risk mapping on individual buildings, using image data from drones—now she wanted to see if wider-resolution images could apply a similar approach to entire cities. Xu and Ray, both master’s students focusing on artificial intelligence in the Department of Electrical Engineering and Computer Science, responded to the call.

Katherine Xu ’22, M.Eng. ’23
“I specifically was really interested in how this opportunity would combine artificial intelligence, which has been my background, with a problem for social good—actually being able to use AI to solve these critical challenges,” says Xu, now a PhD student in computer science at the University of Pennsylvania.
“When we first got in, the project was pretty broad,” adds Ray, who now works on artificial intelligence projects at Microsoft. “We narrowed it down to using image segmentation techniques to segment aerial images, and link that to flood and heat risk.”
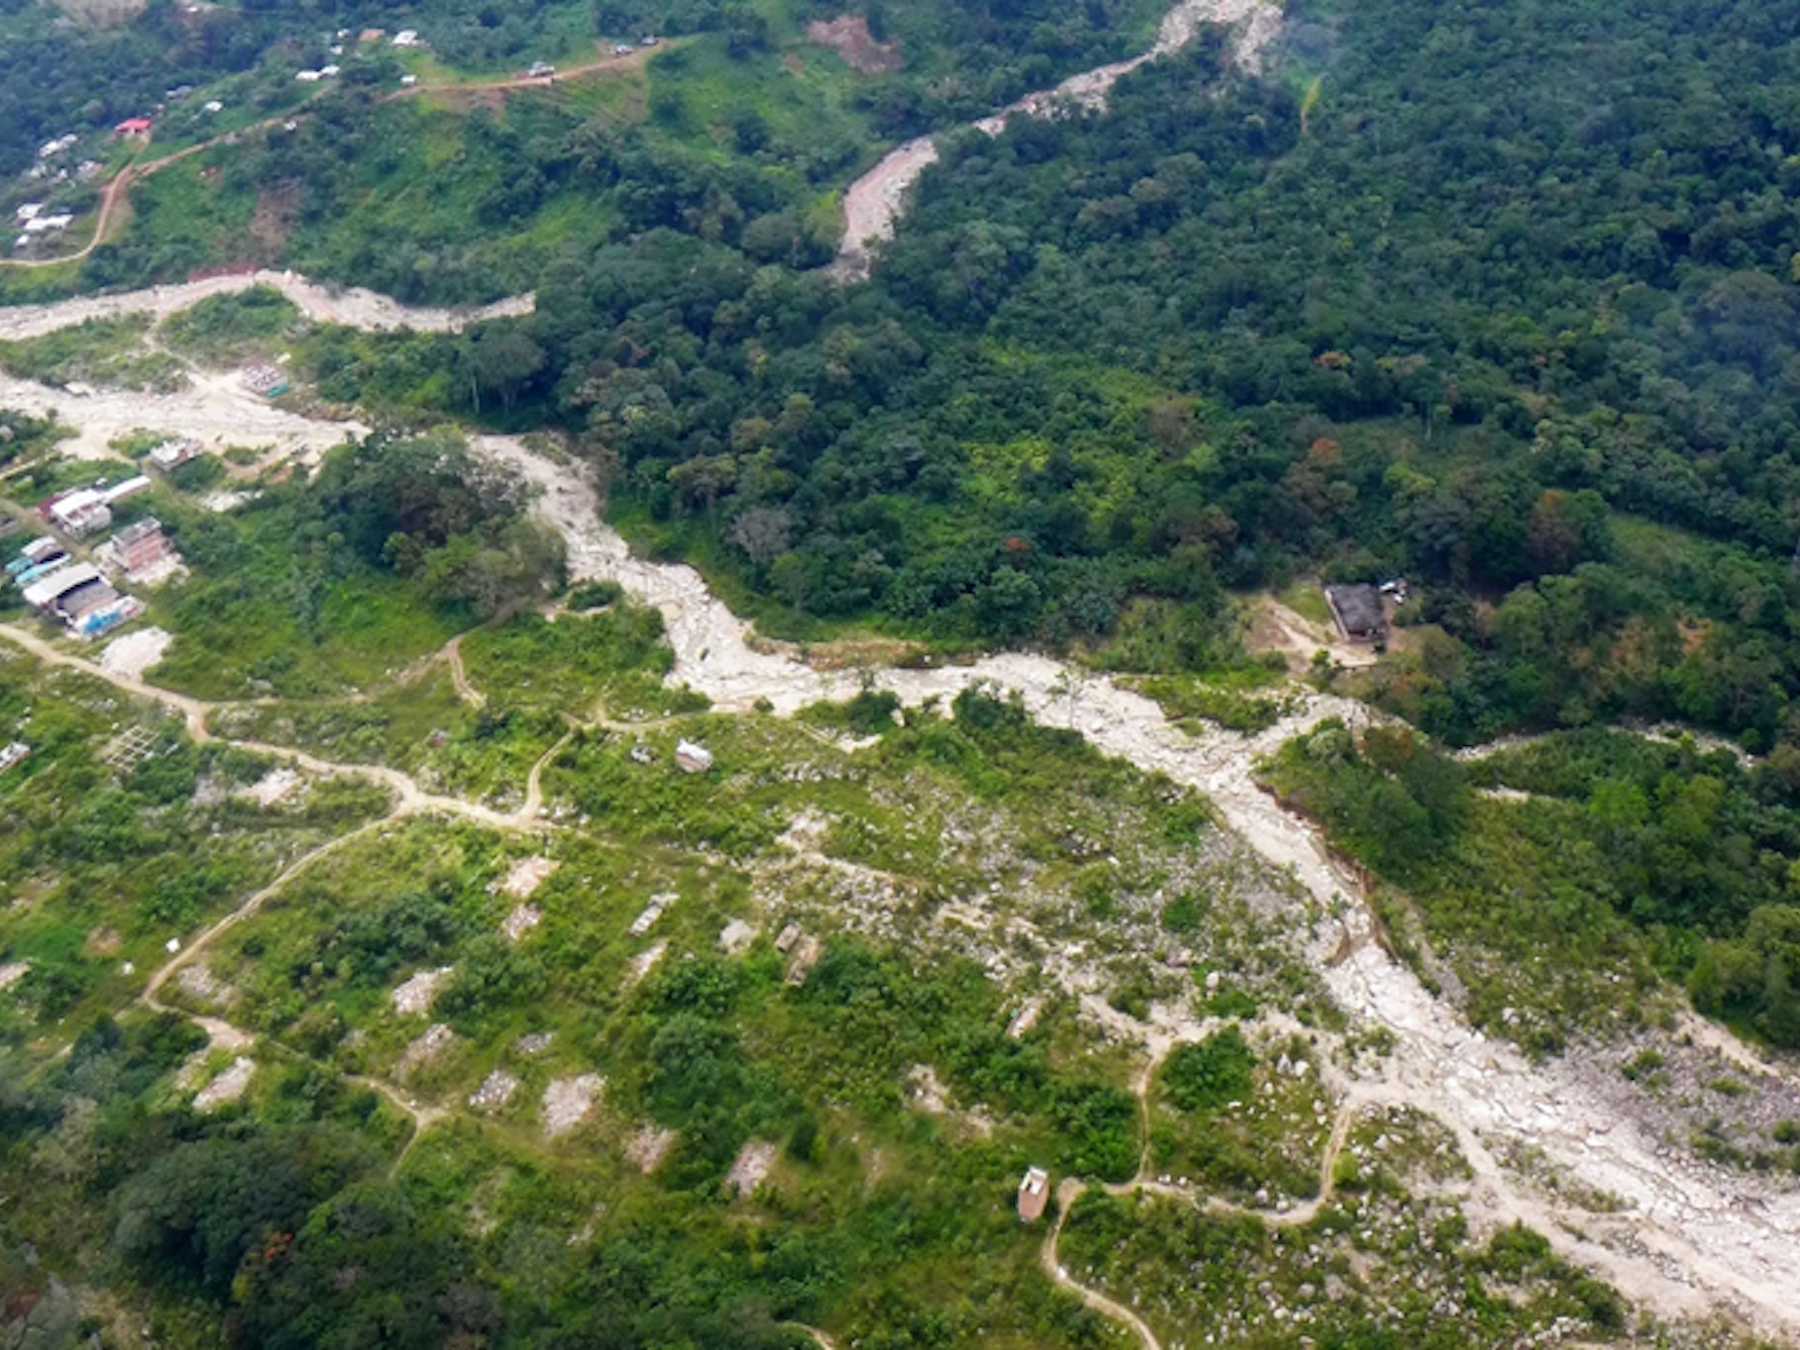
“Image segmentation” is the ability to break down an image into the different types of objects being depicted. Our brains do this automatically—picking out a tree here, a brick wall there—but a computer has to be trained. “What we did was segment aerial images, like what you see in Google Maps or Apple Maps,” says Ray. “So the classes that we were interested in were trees, grass, roads, sidewalks, soil, and then buildings and water. And for each image, we were able to train a model to find those areas with pretty good accuracy.”
This information is relevant to heat and flood risk because these different terrains can provide shade, evaporative cooling and water absorption on the one hand, or hot surfaces and places for water to pool on the other. Working with aerial images of Boston, the student team manually labeled each pixel until they’d built a large enough dataset for their model to segment new images on its own.
“Which is good, because the land cover for a specific area can change over time,” says Xu. “We want this segmentation model to be able to adapt,” changing its estimates of risk as trees are planted or parks are paved.

Anushka Ray ’22, M.Eng. ’23
But aerial images provide only very partial information on the factors that determine whether a street will flood or an apartment building will bake. Xu, who worked on the heat risk portion of the project, also brought in records of Boston surface temperatures; Ray, working on flood risks, layered in a map of slope and elevation.
And both concentrated on the human aspects of the environment as well. The Boston Buildings Inventory, maintained by the city government, allowed them to add information about building age and height, and how much air conditioning was available; and the American Community Survey, taken annually by the U.S. Census Bureau, lets the model see what percentage of each census tract falls into more vulnerable groups like those with low incomes, disabilities, or those under age 6 or over age 65.
Combining these factors required some judgment calls, and Ray and Xu consulted the past literature on heat and flood risks to assign a “weight” to each of their variables. After evaluating every factor, the models create maps of risk down to individual census tracts—small areas of about 4,000 residents each.
To validate that these risks are accurate, Ray and Xu compared it to other maps created with different techniques. For flooding, they consulted the Climate Ready Boston map produced by the city. “I saw that for all of the census tracts that have high risk in my model, they were also predicted on the map to experience coastal flooding or storm water flooding at some point in the future,” says Ray. Xu found similar results comparing her model’s heat risk predictions to those in Risk Factor, a tool created by the nonprofit First Street Foundation.
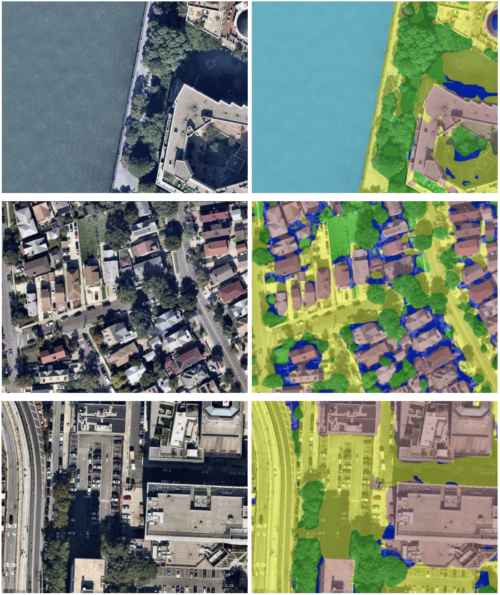
The model takes aerial image data (left) and segments it into different types of terrain relevant to heat and flood risk (right). These images come from New York City, which the model successfully segmented after training on Boston data.
There are also hints in the city’s design and planning that can help validate the model. “For example, we would expect to see that census tracts that have the highest heat risk would also be closest to the cooling centers,” says Xu. “So I went to the City of Boston website, and I was able to find a map of all of the cooling centers in Boston. What I found here is that all the top 10 census tracts from my model are within a 10-minute walk of one of these cooling centers.”
The new tool this team built is just one of several estimating climate risks in cities, but the combination of image segmentation with publicly accessible data does give it some unique advantages. “As long as we have the aerial images for a specific region, we’re able to very quickly extract the segmentation images,” says Xu. “This would be helpful in the case where we might see the land cover for an area changing over time, or if we want to adapt our heat risk or flood risk models to other cities.”
And the team has already demonstrated that the imaging portion of the model can capably handle new cities, quickly generating a map of New York City that parcels out the different types of terrain.
It’s an important first step toward making a model that can map climate risks all around the country—without having to collect brand-new data or rethink risk factors from the ground up with each new city looking to understand where it needs to adapt.